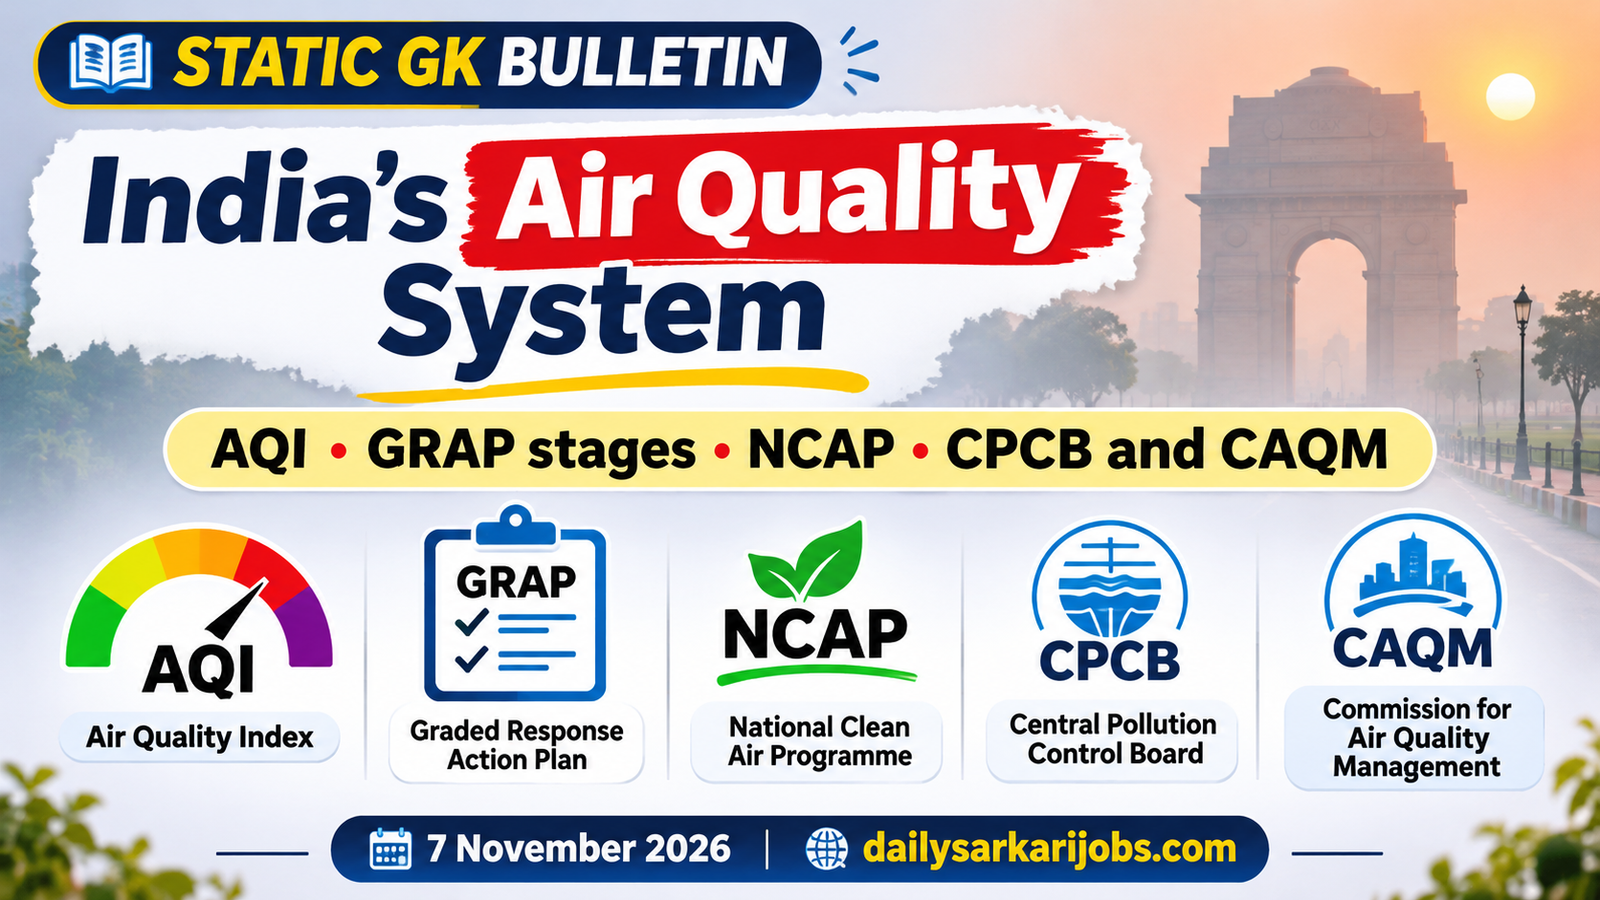
Every winter the air quality number is in the news, and almost everybody reads it wrongly.Understand one thing about how it is built and the whole topic — the index, the emergency plan, the institutions — falls into place.
The AQI Is Not an Average. It Is the Worst Number in the Room
The Air Quality Index is calculated for eight pollutants separately. Each gets its own score, called a sub-index. The AQI you see reported is simply the highest of them.
So if the sub-index for PM2.5 is 320, and every other pollutant is sitting comfortably under 60, the city’s AQI is 320.Nothing is averaged out and nothing is forgiven.The index is built on the view that a single pollutant at a dangerous level is a dangerous day, whatever the other seven are doing.
That design decision explains almost everything people find confusing about the number.It is why the AQI can look far worse than the air feels, why it is nearly always PM2.5 that drives it in winter, and why reducing one pollutant can move the headline figure a long way.
Jargon, Defined Once
PM10 and PM2.5 are particles smaller than 10 and 2.5 micrometres across. The number is a size, not a quantity — and smaller is worse, because finer particles travel deeper into the lungs.
A sub-index is the score for one pollutant on its own. The AQI is the worst sub-index, not the average.
NAAQS are the National Ambient Air Quality Standards — the legal limits the AQI scores against.
A non-attainment city is one that has failed to meet those standards over a period. The phrase is a label for a problem, not a punishment.
Ambient simply means the outdoor air around us, as against indoor air or emissions measured at a chimney.
The Six Categories
Category
AQI range
Good
0 – 50
Satisfactory
51 – 100
Moderately polluted
101 – 200
Poor
201 – 300
Very poor
301 – 400
Severe
401 – 500
Notice that the bands are not equal.The first two are fifty points wide and the rest are a hundred. The scale is built around health effects, not around tidy arithmetic.
The Eight Pollutants, and the Rule About Data
The eight are PM10, PM2.5, nitrogen dioxide, sulphur dioxide, carbon monoxide, ozone, ammonia and lead.
An overall AQI is published only if at least three pollutants have data, and one of them must be PM2.5 or PM10.Without a particulate reading there is no index — which tells you which pollutant the system is really built around.
A sub-index needs at least 16 hours of data to be computed.
The index was recommended by an expert group with IIT Kanpur, and was brought in under the Swachh Bharat Mission.
GRAP: The Plan That Switches Itself On
The Graded Response Action Plan is the set of emergency restrictions for Delhi and the National Capital Region, run by the Commission for Air Quality Management.Its whole point is that it is automatic: the restrictions are tied to AQI thresholds, so nobody has to be persuaded that things have got bad enough.
Stage
Name
AQI that triggers it
Stage I
Poor
201 – 300
Stage II
Very Poor
301 – 400
Stage III
Severe
401 – 450
Stage IV
Severe Plus
Above 450
Note the join between the two tables, because this is where questions are built.The first three GRAP stages line up exactly with the AQI categories of Poor, Very Poor and Severe. But the AQI scale stops at 500 and its Severe band runs 401 to 500, while GRAP splits that same band in two at 450 and adds a fourth stage above it.Severe is one AQI category but two GRAP stages.
Who Does What
Body
What it is
Role here
CPCB
Central Pollution Control Board
Publishes the AQI and sets standards with the ministry
CAQM
Commission for Air Quality Management in the NCR and Adjoining Areas
Runs GRAP; a statutory body created by its own Act of 2021
MoEFCC
Ministry of Environment, Forest and Climate Change
Runs the NCAP and owns the policy
The National Clean Air Programme was launched in January 2019 by the environment ministry.
It covers 131 cities across 24 States and Union Territories, described as non-attainment and million-plus cities.
Its target is a reduction of up to 40 per cent in PM10, or meeting the national standard, by 2025-26.
GRAP is an emergency brake for one region; the NCAP is a long programme for the whole country. The two are constantly mixed up.
Exam Alert: Four Traps
The AQI is the worst sub-index, not an average.The single most asked conceptual point on this topic.
GRAP is CAQM and NCR only. NCAP is the ministry and the whole country.Different body, different scope, different purpose.
Severe is AQI 401 to 500, but GRAP Stage III stops at 450 and Stage IV is above 450. The two scales do not end at the same place.
Eight pollutants in the AQI, and the overall index needs three of them with PM2.5 or PM10 among them. A question offering six or twelve pollutants is confusing the AQI with the ambient standards.
Did You Know: You Cannot Compare an AQI Across Countries
An AQI of 150 in India and an AQI of 150 somewhere else are not the same air.Every country builds its index on its own standards and its own breakpoints, so the same concentration of the same pollutant converts into different numbers.
The index is a translation, not a measurement.What is actually measured is a concentration — micrograms per cubic metre. The AQI turns that into a number on a scale chosen to mean something to the public. Change the scale and the number changes while the air does not.So compare concentrations across countries, and compare the index only against itself.
Why a Reader Should Care
Environment is a scoring section and air quality is its most reliably asked chapter, because the news supplies a fresh example every winter. The institutions, the numbers and the stages recur year after year and do not change.
It sits alongside our capsules on national parks and protected areas and on the Indian monsoon, which explains the seasonal half of the problem: the winds that clear the air in summer die down in winter, and the same emissions then have nowhere to go. Our explainer on the National Green Hydrogen Mission covers one of the long-term answers.
Today’s Current Affairs explainer is on the Supreme Court’s ruling on the 24-hour rule, and the two share a design idea. Both are systems where a number does the deciding. Twenty-four hours forces a release; an AQI reading forces a set of restrictions. A threshold that acts on its own is how you remove the need to argue.
Practice Questions
Q1. The overall Air Quality Index for a city is (a) The average of the sub-indices (b) The highest of the sub-indices (c) The sub-index for PM2.5 alone (d) The sum of the sub-indices Answer: (b) The highest of the sub-indices A single pollutant at a dangerous level therefore sets the figure, whatever the other seven are doing.
Q2. How many pollutants are covered by the National Air Quality Index? (a) Six (b) Twelve (c) Eight (d) Four Answer: (c) Eight They are PM10, PM2.5, nitrogen dioxide, sulphur dioxide, carbon monoxide, ozone, ammonia and lead.
Q3. An AQI value of 350 falls in which category? (a) Poor (b) Severe (c) Moderately polluted (d) Very poor Answer: (d) Very poor The band from 201 to 300 is Poor and the band from 401 to 500 is Severe, so this one sits between them.
Q4. Stage IV of the Graded Response Action Plan, called Severe Plus, is triggered when the AQI is (a) Above 450 (b) Above 300 (c) Above 400 (d) Above 500 Answer: (a) Above 450 Stage III covers the range from 401 to 450, so the fourth stage splits the AQI Severe band rather than extending beyond it.
Q5. The Graded Response Action Plan for Delhi and the NCR is implemented by (a) The Central Pollution Control Board (b) The Ministry of Environment, Forest and Climate Change (c) The Commission for Air Quality Management (d) The National Green Tribunal Answer: (c) The Commission for Air Quality Management That body was created by its own Act in 2021, while the National Clean Air Programme is run by the ministry across 131 cities.
30-Second Revision
The hinge:the AQI is the worst sub-index, never an average. One bad pollutant makes a bad day.
The scale:Good 0-50, Satisfactory 51-100, Moderately polluted 101-200, Poor 201-300, Very poor 301-400, Severe 401-500, over eight pollutants, with at least three needed and PM2.5 or PM10 among them.
GRAP: run by CAQM for Delhi-NCR; Stage I 201-300, Stage II 301-400, Stage III 401-450, Stage IV above 450.
NCAP: launched January 2019 by MoEFCC, 131 cities, target up to 40 per cent PM10 reduction or meeting the standard by 2025-26.
The bodies:CPCB publishes the index, CAQM runs GRAP under its 2021 Act, MoEFCC runs the NCAP.
What Is Not Settled
Two honest notes. First, the launch date of the AQI is reported two different ways — a government source dates it to October 2014, while it is also widely described as launched in April 2015, when the public dashboard and the scheme were rolled out. Both refer to real events. If a question asks, follow the year your own syllabus material uses, and prefer the institutions and the bands, which are not in dispute.
Second, GRAP’s schedule is revised from time to time — the stage thresholds above are from the CAQM schedule as revised in September 2026. The four stages and their AQI ranges have been stable, but the specific restrictions inside each stage do change, so check the current schedule before quoting what is actually banned at a given stage.
Sources
Central Pollution Control Board material on the National Air Quality Index, as summarised by the Government of India’s Arthapedia — the eight pollutants, the six categories and their ranges, the rule that the overall AQI is the worst sub-index, the minimum of three pollutants including PM2.5 or PM10, the 16-hour data requirement, and the role of IIT Kanpur and the expert group.
The Commission for Air Quality Management GRAP schedule, revision dated 29 September 2026 — the four stages, their names and the AQI ranges that trigger them.
Press Information Bureau material on the National Clean Air Programme — the launch in January 2019 by the Ministry of Environment, Forest and Climate Change, the coverage of 131 cities across 24 States and Union Territories, and the target of up to 40 per cent reduction in PM10 or meeting the national standard by 2025-26.